Complex iPhone lineup, Services driving Apple's first quarter revenue

Increased use of Apple services and increased demand of expensive iPhone models will drive Apple's first quarter results, according to a new survey.
The iPhone 12 Pro Max matches iPhone 12 demand
The iPhone 12, iPhone 12 mini, iPhone 12 Pro, and iPhone 12 Pro Max released in late 2020 across October and November. The split release has caused some issues with year-over-year analysis, but trends are forming.
Data analyst group Consumer Intelligence Research Partners (CIRP) has released its first-quarter analysis of iPhone sales and services data. The data shows that similar to prior years reports, that the highest-end iPhones are the models most popular with US consumers, despite a lower overall demand for the 2020 flagships models as compared to the 2019 lineup, versus the 2019 to 2018 balance.
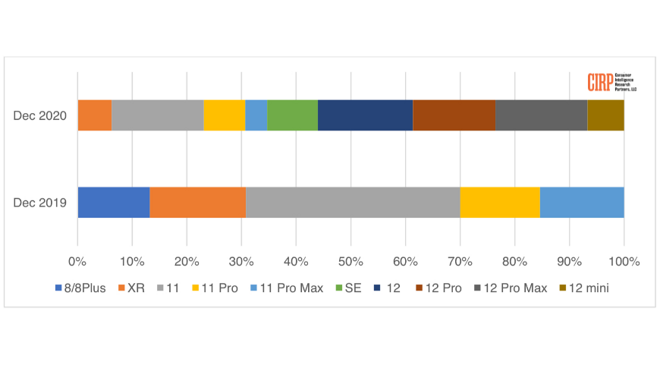
iPhone models US sales mix Source: CIRP
The iPhone 12 and the iPhone 12 Pro Max each make up 17% of total iPhone sales for a total of 34%. The entire iPhone 12 lineup accounts for 56% of the sales data. This 56% is down from the nearly 70% share the iPhone 11 family had in the year-ago quarter.
The decrease in percent-shared demand for the flagship iPhone models is due to the complexity of 2020's iPhone lineup. The introduction of the iPhone SE in the spring and four models in the fall added a lot of complexity.
The increase in iPhone 12 Pro Max demand has caused a new all-time-high US Weighted Average Retail Price (US-WARP) of $873, up from $809 in the December 2019 quarter. US-WARP is similar to average sale price (ASP), a metric Apple used to report.
"For the full quarter, the new iPhone 12 models, and in particular the most expensive ones, garnered a significant share of sales," said Josh Lowitz, CIRP Partner and CO-Founder. "Even though these models were not available for the entire quarter, the model mix and pricing drove US-WARP to $873, the highest level we've seen in the almost 10 years we've surveyed iPhone buyers."
The iPhone 12 is priced $100 more than the iPhone 11 and is a bestseller alongside the expensive iPhone 12 Pro Max. CIRP also found that around half of buyers upgrade from base storage, further increasing the ASP.
The previous report showed iPhone 12 at 27% of total iPhone sales and the iPhone 12 Pro and iPhone 12 Pro Max making up about 22% of sales each. The increase in sales in older iPhones during the holiday quarter coupled with high demand for the iPhone 12 Pro Max showed the trend moving towards the more-expensive model.
The iPhone 12 mini demand remains relatively low, and hasn't changed much since release. This reflects data provided by Ming-Chi Kuo about limited iPhone 12 mini demand.
CIRP also examined Apple's services platforms. The survey shows that more customers are subscribed to Apple Music, Apple TV+, and higher iCloud storage than in 2019. Apple News and Podcasts were relatively flat year-over-year and customers continue to avoid Apple Care.
The data doesn't appear to take into account the changes with Apple One and how that might affect their survey.
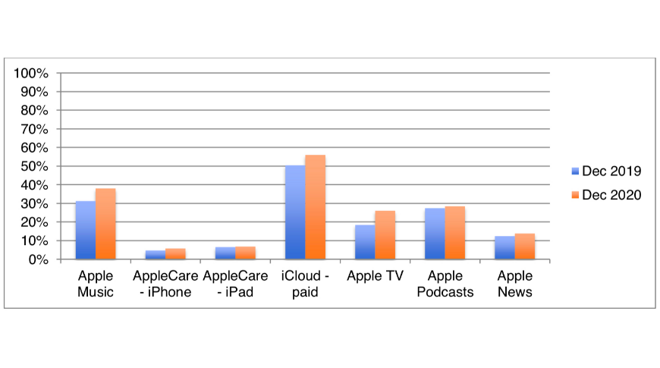
Services penetration Source: CIRP
"Apple Music and Apple TV improved penetration nicely in the quarter, so over one-third of customers have the streaming music service, and over one-quarter have streaming video," said Mike Levin, CIRP Partner and Co-Founder. "Apple always had decent uptake of iCloud storage, with over half of buyers reporting paid usage."
CIRP data is obtained by surveying customers. This survey included 500 US Apple customers that purchased an iPhone, iPad, Mac, or Apple Watch from October to December 2020. This data obtained from a relatively small sample size could reflect greater market trends but is not guaranteed to be as accurate as data obtained from sales figures.
The iPhone 12 Pro Max matches iPhone 12 demand
The iPhone 12, iPhone 12 mini, iPhone 12 Pro, and iPhone 12 Pro Max released in late 2020 across October and November. The split release has caused some issues with year-over-year analysis, but trends are forming.
Data analyst group Consumer Intelligence Research Partners (CIRP) has released its first-quarter analysis of iPhone sales and services data. The data shows that similar to prior years reports, that the highest-end iPhones are the models most popular with US consumers, despite a lower overall demand for the 2020 flagships models as compared to the 2019 lineup, versus the 2019 to 2018 balance.
iPhone models US sales mix Source: CIRP
The iPhone 12 and the iPhone 12 Pro Max each make up 17% of total iPhone sales for a total of 34%. The entire iPhone 12 lineup accounts for 56% of the sales data. This 56% is down from the nearly 70% share the iPhone 11 family had in the year-ago quarter.
The decrease in percent-shared demand for the flagship iPhone models is due to the complexity of 2020's iPhone lineup. The introduction of the iPhone SE in the spring and four models in the fall added a lot of complexity.
The increase in iPhone 12 Pro Max demand has caused a new all-time-high US Weighted Average Retail Price (US-WARP) of $873, up from $809 in the December 2019 quarter. US-WARP is similar to average sale price (ASP), a metric Apple used to report.
"For the full quarter, the new iPhone 12 models, and in particular the most expensive ones, garnered a significant share of sales," said Josh Lowitz, CIRP Partner and CO-Founder. "Even though these models were not available for the entire quarter, the model mix and pricing drove US-WARP to $873, the highest level we've seen in the almost 10 years we've surveyed iPhone buyers."
The iPhone 12 is priced $100 more than the iPhone 11 and is a bestseller alongside the expensive iPhone 12 Pro Max. CIRP also found that around half of buyers upgrade from base storage, further increasing the ASP.
The previous report showed iPhone 12 at 27% of total iPhone sales and the iPhone 12 Pro and iPhone 12 Pro Max making up about 22% of sales each. The increase in sales in older iPhones during the holiday quarter coupled with high demand for the iPhone 12 Pro Max showed the trend moving towards the more-expensive model.
The iPhone 12 mini demand remains relatively low, and hasn't changed much since release. This reflects data provided by Ming-Chi Kuo about limited iPhone 12 mini demand.
CIRP also examined Apple's services platforms. The survey shows that more customers are subscribed to Apple Music, Apple TV+, and higher iCloud storage than in 2019. Apple News and Podcasts were relatively flat year-over-year and customers continue to avoid Apple Care.
The data doesn't appear to take into account the changes with Apple One and how that might affect their survey.
Services penetration Source: CIRP
"Apple Music and Apple TV improved penetration nicely in the quarter, so over one-third of customers have the streaming music service, and over one-quarter have streaming video," said Mike Levin, CIRP Partner and Co-Founder. "Apple always had decent uptake of iCloud storage, with over half of buyers reporting paid usage."
CIRP data is obtained by surveying customers. This survey included 500 US Apple customers that purchased an iPhone, iPad, Mac, or Apple Watch from October to December 2020. This data obtained from a relatively small sample size could reflect greater market trends but is not guaranteed to be as accurate as data obtained from sales figures.
Comments
As usual, this quarter will be the blowout quarter but we'll have wait much longer to see if the results show an improvement over previous years.
The moves they have implemented were steps in the right direction.
I just realized that I misread the graphic. I thought the vertical axis was percentage of profits. It’s not, it’s percentage of Users. So the inclusion of ATV+ makes more sense. It also explains why they included Paid under iCloud. We all get an unpaid account, but only some of us pay for more. But you’re right, the more I study this, the graphic isn’t terribly useful.