Optimizing Metal: Ways to improve code made for Apple's graphics framework

There is a vast array of ways to optimize your Metal graphics code to get top performance. Here's how to get started getting your code into better shape for the Metal framework.
Apple GPU architecture
Apple GPUs are Tile-Based Deferred Renderers - which means they use two main passes: tiling, and rendering. The overall rendering pipeline is shown below.
You can think of these two phases as one when geometry is calculated and created, and another when all pixel rendering is processed.
In most modern Apple GPU software, geometry is calculated and broken down into meshes and polygons, then rendered to a pixel-based image, one image per frame.
Modern Apple GPUs have specific subsections in each core that handle shaders, textures, a pixel backend, and dedicated tile memory. Each core uses these four areas during rendering.
During each frame render, multiple passes are used, running on multiple GPU cores, with each core processing multiple tasks. In general, the more cores, the better the performance.
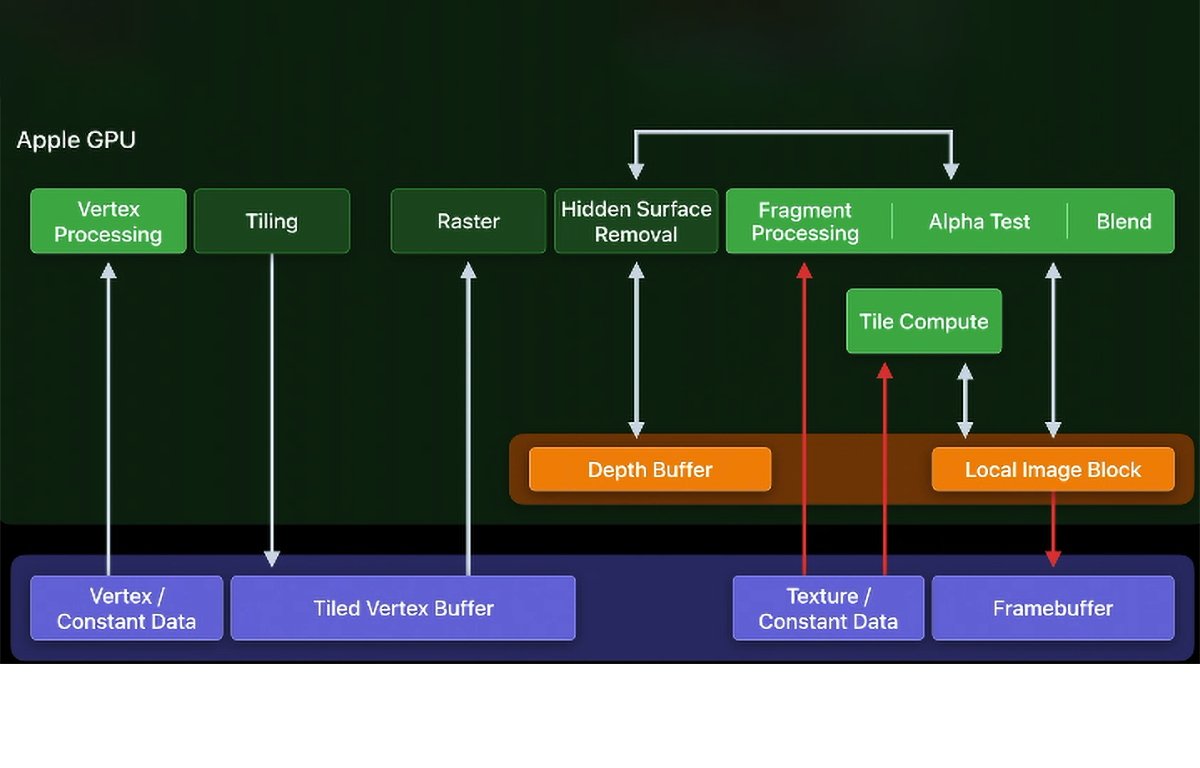
Modern Apple GPU rendering pipeline.
GPU Counters
To measure this performance, GPU counters are used.
GPU counters keep track of each GPU's load and measure if each does or doesn't have enough work. They also find performance bottlenecks.
Finally, GPU counters optimize the commands that take the longest in order to speed up performance.
There are over one hundred and fifty types of Apple GPU performance counters, and covering them all is beyond the scope of this article.
There is the problem of making sense of all the performance counter data. To do this, you use the Metal System Trace and Metal Debugger built-in to Xcode and Instruments.
We covered Metal System Trace and Debugger in a previous Metal article.
There are four Metal GPU Counters which include important ways to optimize Metal in your apps and games. They are:
- Performance limiters
- Memory Bandwidth
- Occupancy
- Hidden Surface Removal
, or limiter counters measure the activity of multiple GPU subsystems by finding the work being executed, and finding stalls that can block or slow down parallel execution.
Modern GPUs execute math, memory, and rasterization work in parallel (at the same time). Performance limiters help identify performance bottlenecks that slow down your code.
You can use Apple's Instruments app to use performance limiters to optimize your code. There are half a dozen different performance limiters in Instruments.
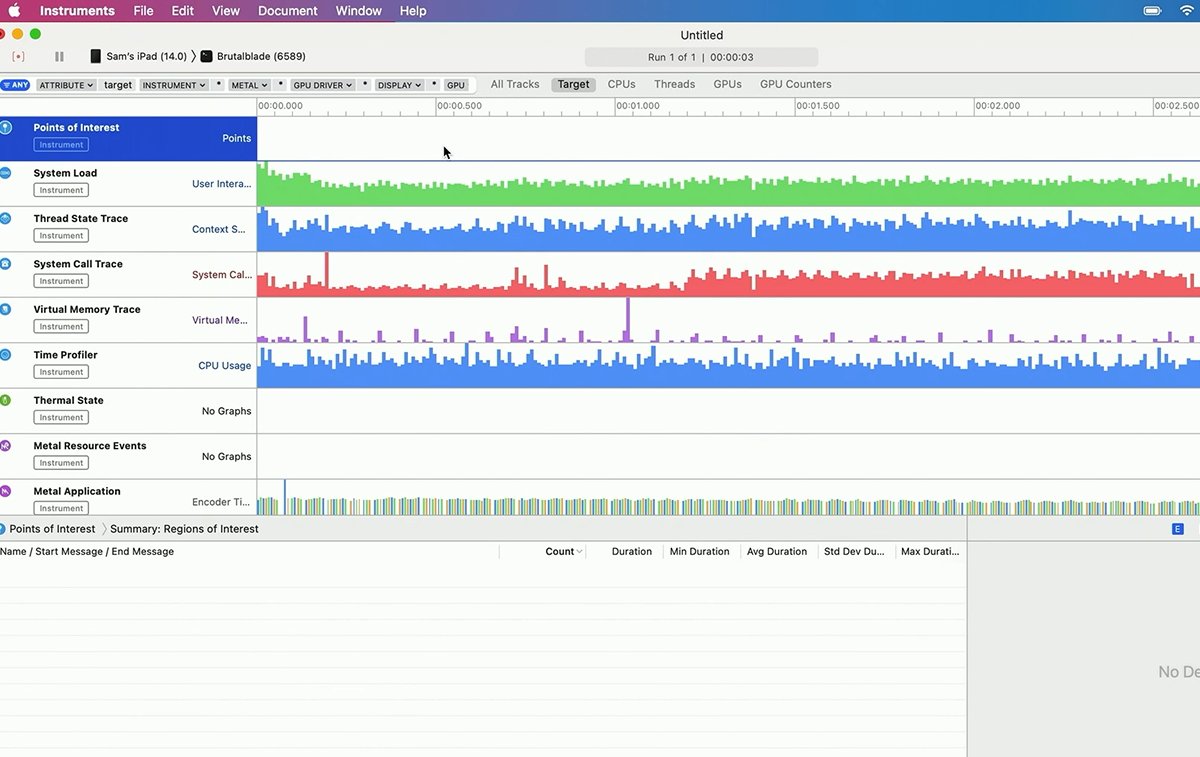
Apple's Instruments app.
Memory Bandwidth Counters
Memory bandwidth GPU counters measure transfers between GPU and system memory. The GPU accesses system memory whenever buffers or textures are accessed.
But be aware that System Level Caches can also be triggered, which means you may occasionally notice small bursts of higher memory throughput than actual DRAM transfer speeds. This is normal.
If you see a memory bandwidth counter with a high value it likely means that transfer is slowing down your rendering. To alleviate these bottlenecks there are several things you can do.
One way to reduce memory bandwidth slowdowns is to reduce the size of working data sets. This speeds things up because less data is being transferred from system memory.
Another way is to only load data needed by the current render pass, and to only store data needed by future render passes. This also reduces the overall data size.
You can also use block texture compression (ASTC) to reduce texture asset sizes, and lossless compression for textures generated at runtime.
Occupancy measures how many threads are currently executing out of the total thread pool. 100% occupancy means a given GPU is currently maxed out in terms of the number of threads and overall work it can handle.
The Occupancy GPU counter measures the percentage of total thread capacity used by the GPU. This total is the sum of the compute, vertex, and fragment occupancy.
Hidden Surface Removal usually occurs somewhere in the middle of each render pass before fragment processing - shortly after the Tiled Vertex Buffer is sent to the GPU to be rasterized.
Depth buffers and hidden surface removal are used to eliminate any surfaces that are not visible to the view's camera in the current scene. This speeds up performance because those surfaces don't need to be drawn.
For example, surfaces on the backsides of opaque 3D objects don't need to be drawn because the camera (and the viewer) never see them - so there's no point in drawing them.
Surfaces hidden by other 3D objects in front of them relative to the camera are also removed.
GPU counters can be used during hidden surface removal to find the total number of pixels rasterized, the number of fragment shaders (actually the number of calls to fragment shaders), and the number of pixels stored.
GPU counters can also be used to minimize blending, which also incurs a performance cost.
To optimize drawing with hidden surface removal, you'll want to draw objects by order of visibility state - namely testing whether or not objects are opaque, testing by translucency, and trying to avoid interleaving opaque and non-opaque meshes.
Resources
There are a variety of Metal resources available including Apple's Metal Developer pages at developer.apple.com/metal/tools/, WWDC videos, and the excellent third-party book Metal Programming Guide: Tutorial and Reference via Swift by Janie Clayton.
To get started with Metal optimization, be sure to check out the WWDC videos Optimize Metal apps and games with GPU counters from WWDC20, Harness GPUs w Metal also from WWDC20, and Delivering Optimized Metal Apps + Games from WWDC19.
Next, read Capturing a Metal workload in Xcode and Metal Debugging Types on the Metal Debugger pages on Apple's Developer Documentation website.
There is also Analyzing your Metal workload in the Metal Debugger documentation.
You'll definitely want to spend lots of time with Xcode's Metal Debugger and Trace documentation to learn in-depth how the different GPU counters and performance graphs work. Without these, you can't get a detail-level view of what's actually going on in your Metal code.
For compressed textures, it's also worthwhile to read up on Adaptive Scalable Texture Compression (ASTC) and how it works in modern rendering pipelines.
ARM has a great overview of ASTC at its developer website community.arm.com. Also, check out highperformancegraphics.org.
Metal performance optimization is a vast and complicated subject - we've just barely gotten started and will further explore this topic in future articles.
Read on AppleInsider
Comments